使用工作区
重要
从 2025 年 9 月开始,Snowflake 逐步将默认账户从 Worksheets 升级为 Workspaces。工作区将成为默认的 SQL 编辑器。有关更多信息,请参阅 将账户从 Worksheets 默认设置为 Workspaces。
创建和使用文件和文件夹
在工作区中,您可以使用熟悉的 IDE 和源代码控制约定来编写、整理和运行代码。
登录 Snowsight。
在导航菜单中,选择 Projects » Workspaces。
选择相应文件夹旁边的 +。如果您是首次使用工作区,请选择 + Add New。
从以下选项中进行选择,以创建新文件或文件夹,或是上传现有文件或文件夹:
SQL File:在编辑器中创建一个新的空白 SQL 文件,作为编辑器中的选项卡。默认情况下,
.sql会追加到未命名的文件中。编辑器将其识别为 SQL 文件,并启用语法突出显示和自动填充功能。File:创建新文件。命名文件并指定其扩展名。如果编辑器(例如 Java、JavaScript 或 Scala)可以识别该扩展名,则会启用代码突出显示和自动填充功能。
Folder:在工作区内创建一个新的空文件夹。
Upload Files:将一个或多个文件上传到工作区中的任何位置。编辑器利用文件扩展名,在打开文件时为文件应用相应的图标、行为和语法突出显示。例如,
.sql文件会显示 SQL 特定功能。Upload Folder:选择一个或多个要添加到所选工作区的文件或文件夹。
管理文件
您可以重命名、删除、移动和整理工作区、文件和文件夹。
要重命名或删除工作区、文件或文件夹,请执行以下步骤:
将鼠标悬停在目标上并选择垂直省略号 |vertical-ellipsis|(更多操作)。
选择 Rename 或 Delete。如果您选择删除,系统会提示您确认。
要在工作区中创建文件夹,请选择工作区或现有文件夹旁边的 +。
要整理文件和文件夹,请将任何文件或文件夹拖动到同一工作区中的其他位置。您也可以将工作表拖放到工作区中。
Format SQL code
Workspaces include a built-in functionality to format and standardize SQL code for improved readability and maintenance.
In the Workspaces editor, select the horizontal ellipsis.
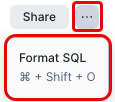
Select Format SQL or use the keyboard shortcut command + shift + O (Windows: CTRL + Alt + O).
Organize sections of code
Use code folding to collapse and expand large blocks of code, allowing you to focus on specific sections and improve overall code navigation.
In the Workspaces editor, locate the code section to collapse.
Hover the mouse to the right of the line numbers. A code folding icon (
 ) appears at the fold line.
Toggle the icon to fold or unfold the section of code.
在一个布局中查看多个文件或结果
使用选项卡和拆分窗格管理多个文件有多方面的优势:
并排比较代码或结果:在处理另一个工作表查询时,快速参考一个工作表查询。
更高效地处理多项任务:只需较少的切换次数,即可同时查看不同的单元格、输出或文件。
To adjust your Workspaces layout, select the vertical ellipsis ( ) in the Workspaces pane and choose the appropriate option:
Split right
Split down
Close others
Exploring query results
When you run a query in Workspaces, you can use interactive features to filter, analyze, and explore your results without writing additional SQL. These features help you quickly understand your data and identify patterns.
备注
These interactive result features are available in Workspaces in different locations than in the legacy Worksheets interface.
Use interactive column statistics
Each column in your query results includes interactive visual statistics (mini graphs or histograms) that help you understand data distribution and quality. You can click these statistics to open a detailed panel and create filters.
To view column statistics:
Run a query in a Workspaces SQL file.
In the results table, show the column statistics by doing one of the following:
Click Show column stats in the top-left corner of the table (next to the column headers).
Click the ellipsis button in any column header and select Show column stats.
Mini graphs (histograms or distribution charts) appear in each column header showing the data distribution.
Click a histogram to view sum and average values for that entire column in the bottom-right of the table.
Alternatively, you can select a range of cells in the results table to view statistics in the bottom-right of the table. For numeric columns, sum and average values are displayed. For non-numeric columns, the count is displayed.
To filter using column statistics:
Click Show column stats in the top-left corner of the results table, or click the ellipsis button in any column header and select Show column stats.
Click the histogram for the column you want to filter by. A popover displays detailed statistics for that column, including:
Sum and average values for numeric columns
Distribution charts showing value frequency
Data quality metrics such as null and filled percentages
In the popover, select the values or ranges you want to filter by.
Select Apply to apply the filter to your results.
This interactive filtering helps you explore your data visually without writing WHERE clauses or other SQL filter logic.
Inspect cell values
The cell inspector provides detailed information about individual cells or selections in your query results.
To inspect a single cell:
In the results table, double-click any cell to open the Inspector Panel.
Review the detailed value, including formatting and data type information.
To view aggregate statistics for multiple cells:
In the results table, select multiple cells by clicking and dragging across rows and columns.
A statistics bar appears at the bottom showing:
Sum of numeric values
Average of numeric values
Count of selected cells
Min and max values in the selection
This feature is useful for quick calculations and data exploration without creating new queries.
键盘快捷键
工作表提供了键盘快捷键,可帮助您快速导航、自定义视图和编辑查询。下表列出了常用键盘快捷键:
任务 |
MacOS 快捷键 |
Windows 快捷键 |
|---|---|---|
运行选定项 |
command + return |
CTRL + Enter |
运行全部 |
command + shift + return |
CTRL + Shift + Enter |
Format SQL file |
command + shift + O |
CTRL + Alt + O |
水平拆分窗格 |
control + \ |
CTRL + \ |
垂直拆分窗格 |
control + shift + \ |
CTRL + Shift + \ |
关闭焦点标签页 |
control + W |
CTRL + Q |
复制所选文件 |
command + C |
CTRL + C |
剪切所选文件 |
command + X |
CTRL + X |
将文件粘贴到所选位置 |
command + V |
CTRL + V |
打开查询结果窗格 |
control + option + ↑ |
CTRL + Alt + ↑ |
关闭查询结果窗格 |
control + option + ↓ |
CTRL + Alt + ↓ |
打开内联 Copilot |
command + I |
CTRL + I |
将代码注释掉 |
command + / |
CTRL + / |
转到文件顶部 |
control + option + ↑ |
CTRL + Alt + ↑ |
转到文件底部 |
control + option + ↓ |
CTRL + Alt + ↓ |
从已删除的用户恢复工作区
即使用户被删除,其个人数据库 (PDB) 及工作空间中的所有文件仍会被保留。然后,PDB 被重命名为 DROPPED_USER$<dropped_user_name>_<timestamp>。
备注
工作区的恢复不仅限于运行 DROP 命令的个人。任何具有同一角色的用户均可恢复该工作区,因为该 PDB 的所有权仍归属于发起命令的角色。
要从已删除用户的 PDB 恢复工作区,请按照以下步骤操作:
查找已删除用户的 PDB。使用 SHOW DATABASES 命令和 LIKE 函数查找特定数据库:
查看 PDB 中的工作区。使用 SHOW WORKSPACES IN DATABASE 命令列出可用工作区:
从恢复的工作区创建一个新工作区。使用 CREATE WORKSPACE ... FROM 命令,从恢复的工作区创建新工作区。
这会将内容复制到新位置,使其可被访问。
备注
您必须使用 USER$ 限定符,将工作区放入您自己的个人数据库中。否则,会发生错误。数据库名称末尾的时间戳各不相同。
限制
Column statistics may take longer to generate as the number of columns increases.
Snowflake Copilot is not available in Workspaces.
查询筛选器 不受支持。任何包含筛选器的查询都将失败。
工作区文件不会包含在 Universal Search 结果中。
在新工作区 UI 和旧工作表 UI 中同时打开和编辑同一个工作表可能会导致更改丢失。
对于工作表,新工作区 UI 和旧工作表 UI 中的执行上下文设置(角色、仓库和命名空间)不同步。