Snowflake Notebooks 中的可视化数据
在 Snowflake Notebooks,您可以使用您最喜欢的 Python 可视化库,例如 matplotlib 和 plotly,来开发您的可视化。
本主题介绍如何使用以下库在笔记本中可视化数据:
数据集
本主题中的示例使用以下基于 Palmer 的 Penguin 数据集 (https://allisonhorst.github.io/palmerpenguins/articles/intro.html) 的玩具数据集。
种类 |
测量 |
值 |
|---|---|---|
adeli |
bill_length |
37.3 |
adeli |
flipper_length |
187.1 |
adeli |
bill_depth |
17.7 |
chinstrap |
bill_length |
46.6 |
chinstrap |
flipper_length |
191.7 |
chinstrap |
bill_depth |
17.6 |
gentoo |
bill_length |
45.5 |
gentoo |
flipper_length |
212.7 |
gentoo |
bill_depth |
14.2 |
您可以使用以下代码在笔记本中创建此数据集:
使用 Altair 可视化结果
Altair 默认在 Snowflake Notebooks 中作为 Streamlit 的一部分导入。Snowflake Notebooks 目前支持 Altair 版本 4.0。有关使用 Altair 时可用的可视化类型的详细信息,请参阅 Vega-Altair:Python 中的声明性可视化 (https://altair-viz.github.io/index.html)。
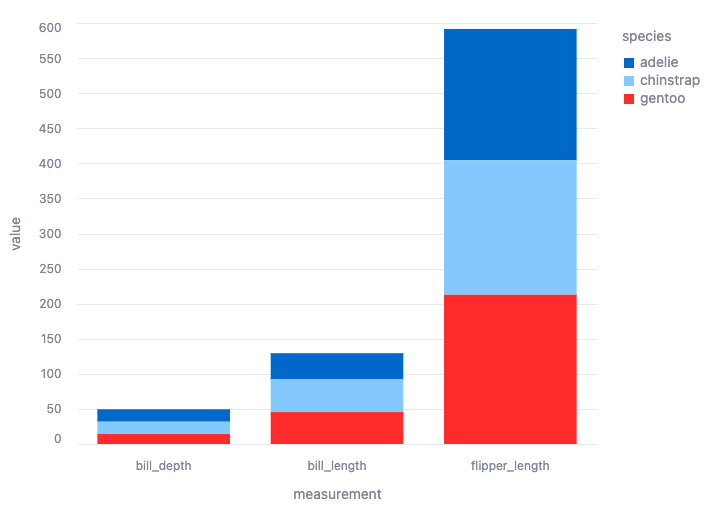
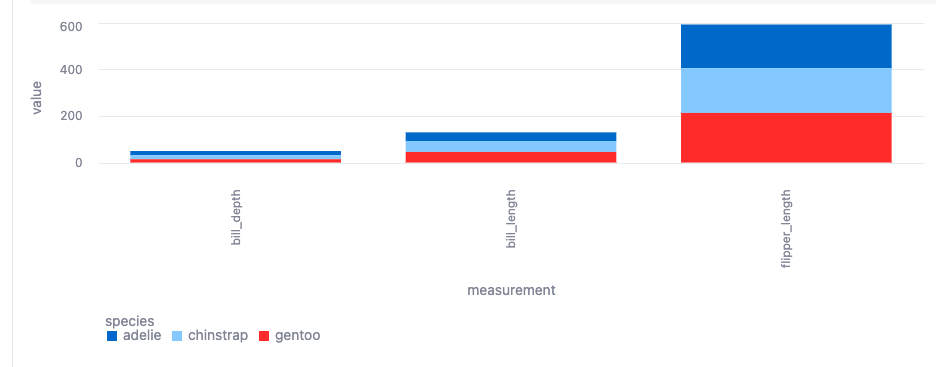
以下代码绘制了一个堆栈条形图,显示名为 df 的数据框中所有测量值,该数据框包含玩具数据集:
运行单元格后,将显示以下可视化效果:
使用 matplotlib 可视化结果
要使用 matplotlib,请为您的笔记本安装 matplotlib 库:
从笔记本中选择 Packages。
找到 matplotlib 库并选择该库进行安装。
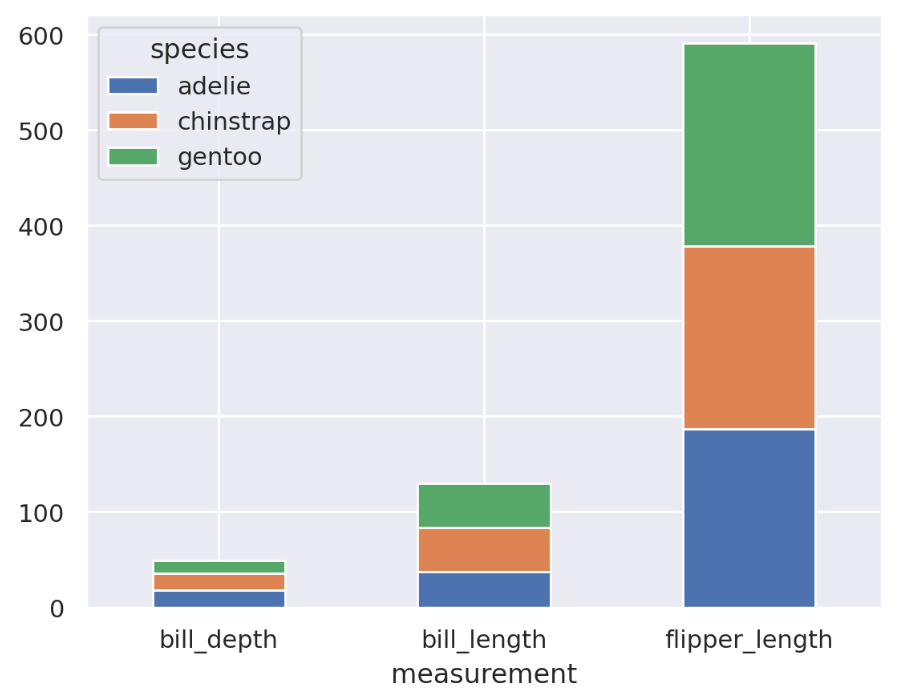
以下代码使用 matplotlib 绘制了玩具数据集 df:
运行单元格后,将显示以下可视化效果:
有关使用 st.pyplot 图表元素,请参阅 st.pyplot (https://docs.streamlit.io/library/api-reference/charts/st.pyplot)。
使用 plotly 可视化结果
要使用 plotly,请为您的笔记本安装 plotly 库:
从笔记本中选择 Packages。
找到 plotly 库并选择该库进行安装。
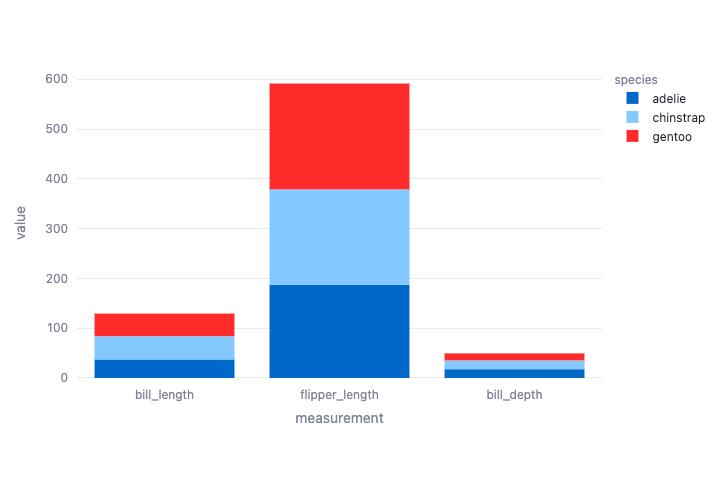
以下代码绘制了来自玩具数据集 df 的 Penguin 测量值的条形图:
运行单元格后,将显示以下可视化效果:
使用 seaborn 可视化结果
要使用 seaborn,您必须为您的笔记本安装 seaborn 库:
从笔记本中选择 Packages。
找到 seaborn 库并选择该库进行安装。
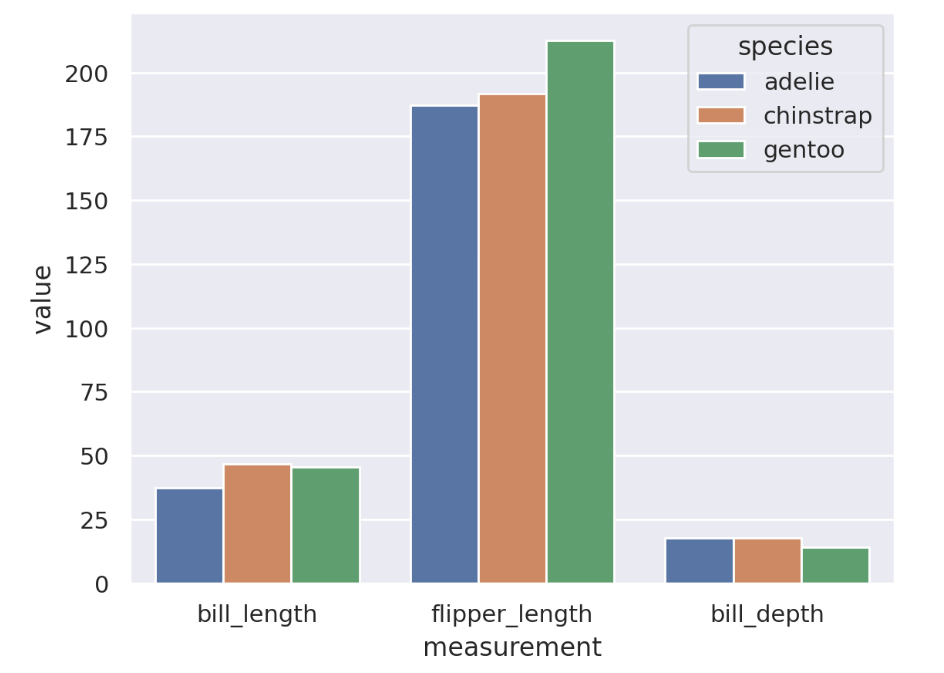
以下代码绘制了来自玩具数据集 df 的 Penguin 测量值的条形图:
运行单元格后,会显示以下可视化效果:
有关 seaborn 可视化的更多示例,请参阅 seaborn 示例图库 (https://seaborn.pydata.org/examples/index.html)。
使用 Streamlit 可视化结果
Streamlit 默认导入 Snowflake Notebooks。您可以使用 Streamlit 版本 1.39.0 支持的图表元素来创建折线图、条形图、面积图或带有点的地图。请参阅 图表元素 (https://docs.streamlit.io/library/api-reference/charts)。
备注
Snowflake 不支持某些 Streamlit 图表元素,或者可能需要遵守附加条款。请参阅 笔记本中的 Streamlit 支持。
要在条形图中可视化玩具数据集 df,可以使用以下 Python 代码:
运行两个单元格后,会显示以下可视化效果:
要了解有关如何使用 Streamlit 构建交互式数据应用程序的更多信息,请参阅 笔记本中的 Streamlit。