使用 Performance Explorer 分析查询工作负载
You can use Performance Explorer in Snowsight to review interactive metrics for SQL workloads. The metrics show the overall health of your Snowflake environment, query activity, changes to warehouses, and changes to tables.
Performance Explorer 的优势
Performance Explorer 可以帮助您回答以下有关 Snowflake 活动的关键问题:
总体活动: 查询通常是否成功?Snowflake 用户能否完成工作?
随着时间的推移而变化: 如果查询活动或资源看起来与我的预期不同,发生了什么变化?这些变化是什么时候发生的?
热点: 当我寻找采取行动的机会时,我应该将注意力集中在哪里?
Performance Explorer 的常见用例
Performance Explorer 可以帮助处理以下用例:
调查有关查询或工作负载的问题报告: 如果 Snowflake 工作负载的行为开始有所不同,请确定最近可能发生的其他变化,例如工作负载所依赖的资源或相邻的工作负载活动。
主动识别热点: 如果仓库或表显示持续存在错误或饱和,请在热点影响关键工作负载之前识别并解决该热点问题。
发现优化机会: 查找可能与其支持的查询活动不匹配的仓库和表,并调整工作负载和资源以使其兼容。
所需权限
Performance Explorer shows account activity that is similar to data in Account Usage views (for example,
query history and
access history). What you can see in each part of the
dashboard depends on your privileges. Snowflake grants the SNOWFLAKE.PERFORMANCE_EXPLORER_PUBLIC_USER
application role to the PUBLIC role so that users can open Performance Explorer in Snowsight;
the following rules determine whether sections show full account data, filtered data, an empty state, or a
permission error.
备注
For Performance Explorer, Snowflake evaluates privileges from all roles granted to you. This is
equivalent to USE SECONDARY ROLES ALL on top of your active primary role for the session.
Full access to Performance Explorer data in the account
You have full access to Performance Explorer data for your account when any role granted to you meets one of the following conditions:
Your role is the ACCOUNTADMIN role.
Your role has been granted
IMPORTED PRIVILEGESon the sharedSNOWFLAKEdatabase (see 允许其他角色使用 SNOWFLAKE 数据库中的架构).Your role has been granted the
SNOWFLAKE.PERFORMANCE_EXPLORER_USERapplication role.
For example, to give the user jdoe full Performance Explorer access by using a custom role, run:
Seeing query metrics without full account access
If you do not have full access as described above, you can still see query activity when any role granted to you satisfies one of the following:
Your role has been granted the
GOVERNANCE_VIEWERdatabase role in theSNOWFLAKEdatabase (account-wide query activity).Your role has the
MONITORprivilege on the account, or theMANAGE WAREHOUSESprivilege on the account, which effectively covers all warehouses (query activity that uses warehouses).Your role has
OWNERSHIP,MONITOR, orOPERATEon at least one warehouse (query activity only for queries that ran on warehouses you can monitor or operate). For details, see Warehouse privileges.
If none of the above apply and you cannot MONITOR or OPERATE any warehouse, Performance Explorer
shows a permission error for query activity. This is intentional: without at least one authorized warehouse,
no query metrics would be visible. In practice, many accounts include a default warehouse that all users
can monitor; see Snowsight templates.
Warehouse filters list warehouses you are allowed to use in filters (for example, warehouses you can
MONITOR or OPERATE, and in some cases warehouses that had query activity in the retention window).
Warehouse-scoped visibility is similar in spirit to the rules for Query History in
使用 Query History 监控查询活动, but Performance Explorer uses all roles granted to you and
combines several privilege types, so the exact rules differ.
Database filters and database-oriented breakdowns
To see all databases in database filters (and related aggregations by database), any role granted to you must satisfy one of the following:
Your role meets the conditions for full access to Performance Explorer data in the account (see the preceding section).
Your role has been granted the
OBJECT_VIEWERdatabase role in theSNOWFLAKEdatabase.Your role has
RESOLVE ALLon the account.Your role has
MONITORon the account.
Otherwise, you only see databases where any role granted to you has at least one privilege on the database. Queries can still appear in other sections even if they touch a database you cannot list, except where the UI explicitly names databases (for example, certain side-panel breakdowns).
Warehouse events
To see warehouse events for all warehouses that appear in your authorized query activity, any role granted to you must satisfy one of the following:
Your role meets the conditions for full access to Performance Explorer data in the account (see the preceding section).
Your role has been granted the
USAGE_VIEWERdatabase role in theSNOWFLAKEdatabase.Your role has the
MONITORprivilege on the account.Your role has the
MANAGE WAREHOUSESprivilege on the account.
Otherwise, warehouse events are limited to warehouses where you have OWNERSHIP,
MONITOR, or OPERATE. If you have none of those warehouse privileges or usage-related database
roles, Performance Explorer shows a permission error for warehouse events.
Top tables and table change events
The Top tables section and table change events require full access or the GOVERNANCE_VIEWER
database role in the SNOWFLAKE database. Snowflake does not offer a lower-privilege, per-table
alternative for these sections due to security and performance constraints. If you do not meet this bar,
those sections show a permission error.
Empty charts, filtered results, and permission errors
For security reasons, an empty chart or table can mean either that there was no activity in the selected period or that your roles cannot see that activity. Tile-level permission errors call out missing privileges (for example, governance visibility for table metrics).
Privilege changes and data freshness
Updates to grants and revocations can take a few hours to affect what Performance Explorer shows.
打开 Performance Explorer
要打开 Performance Explorer,请完成以下步骤:
登录 Snowsight。
在导航菜单中,选择 Monitoring » Performance Explorer。
Performance Explorer 包含图表,这些图表显示与您的工作负载和 Snowflake 环境的总体运行状况相关的指标。
To leave feedback about Performance Explorer, select Feedback.
了解 Performance Explorer 仪表板
You can review interactive metrics for SQL workloads by using charts on the Performance Explorer dashboard, and you can apply filters to show metrics about only the query activity and resources that you're interested in. Charts are grouped under tabs (Queries, Warehouses, and Tables). The page URL updates when you change tabs, and the same tab stays selected if you refresh the page.
Performance Explorer 筛选器
在 Performance Explorer 仪表板的顶部,您可以应用以下筛选器:
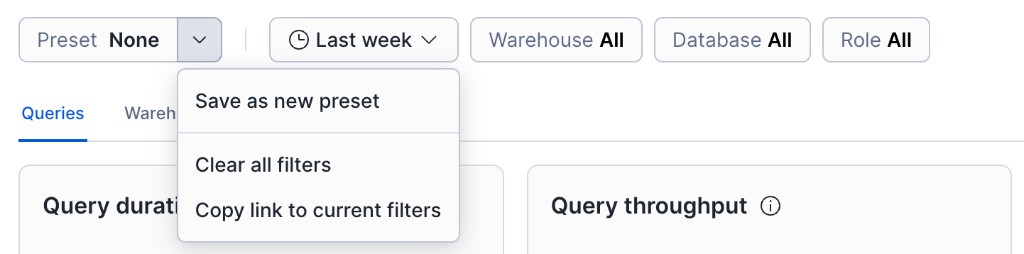
Preset - Choose None or a saved combination of period, warehouse, database, and role filters. From the menu you can save the current filters as a new preset, clear all filters, copy a link that encodes the current filters, and manage saved presets (for example set or change a default preset).
Period – 选择时间段,例如上周、最近两周或自定义范围。仪表板显示指定时间段的指标。
默认情况下,Performance Explorer 显示一周的指标。它支持最长一个月的期限,可以追溯到当前日期。
多个 Performance Explorer 图表显示了与上一时段相比的变化百分比。上一时段的范围与当前时段范围相对应。例如,如果当前时段为两周,则上一时段为当前时段开始前的两周。
Warehouse – 选择一个仓库以仅查看使用该仓库运行的查询活动的指标。要限制列表中的仓库,请使用搜索字段。要清除筛选器,请选择
X。Database - Select a database to view metrics only for query activity that accessed that database. To limit the databases in the list, use the search field. To clear the filter, select
X.Role – 选择一个角色以仅查看该角色发起的查询活动的指标。要限制列表中的角色,请使用搜索字段。要清除筛选器,请选择
X。
Performance Explorer 图表
Performance Explorer 以不同类型的图表显示指标。了解每种图表中的组成部分以及如何解释它们非常重要。
在 Queries 选项卡上,折线图指标 使用的折线图与下图类似:
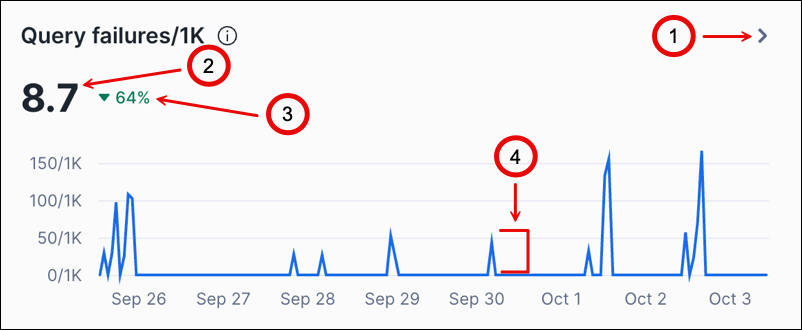
下表描述了图中的标注:
标注 |
描述 |
|---|---|
1 |
Select View details > to open the side panel. View details > appears when you hover over a chart. |
2 |
显示该时段的平均值或中位数。 |
3 |
显示与上一时段相比增加或减少的百分比。 |
4 |
表示一小时的值。这些值显示在间隔开始时的一段时间。例如,如果间隔为一小时,则在 9 AM 处显示的值表示从 9 AM 到 10 AM 的间隔。 |
有些图表包含较大的平均值或中位数以及该时段的变化百分比。当有多条线时,图表上方的关键信息是对应线条的说明。
有些图表的标题旁边有 information icon。将鼠标悬停在图标上可查看与图表中指标有关的信息。
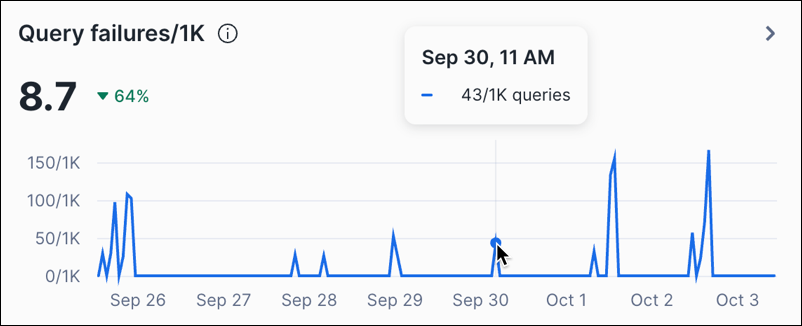
您可以将鼠标悬停在折线图中的某个点上,以查看特定小时的值:
The Top warehouses section on the Warehouses tab and the Top tables section on the Tables tab have bar charts that are similar to the following image:
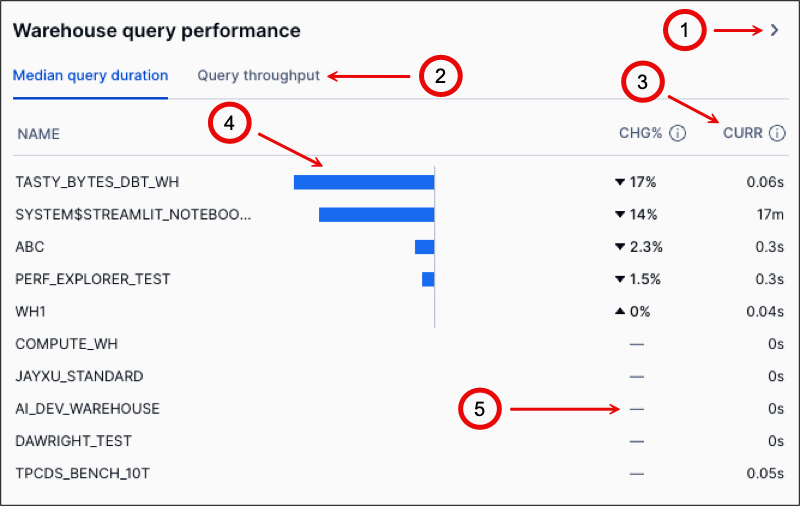
下表描述了图中的标注:
标注 |
描述 |
|---|---|
1 |
Select View details > to open the side panel. View details > appears when you hover over a chart. |
2 |
选择一个选项卡以显示该选项卡上的指标。 |
3 |
显示该指标在当前时段的值。 |
4 |
显示与上一时段相比增加或减少的百分比。 |
5 |
表示没有上一时段的数据可供比较。 |
On both line charts and bar charts, select View details > to open a side panel that displays more detailed information about the metrics on the chart. The detailed information varies based on the metrics shown in the chart. Most side panels present sortable tables that you can use to review metrics for specific warehouses, roles, databases, and queries in the period.
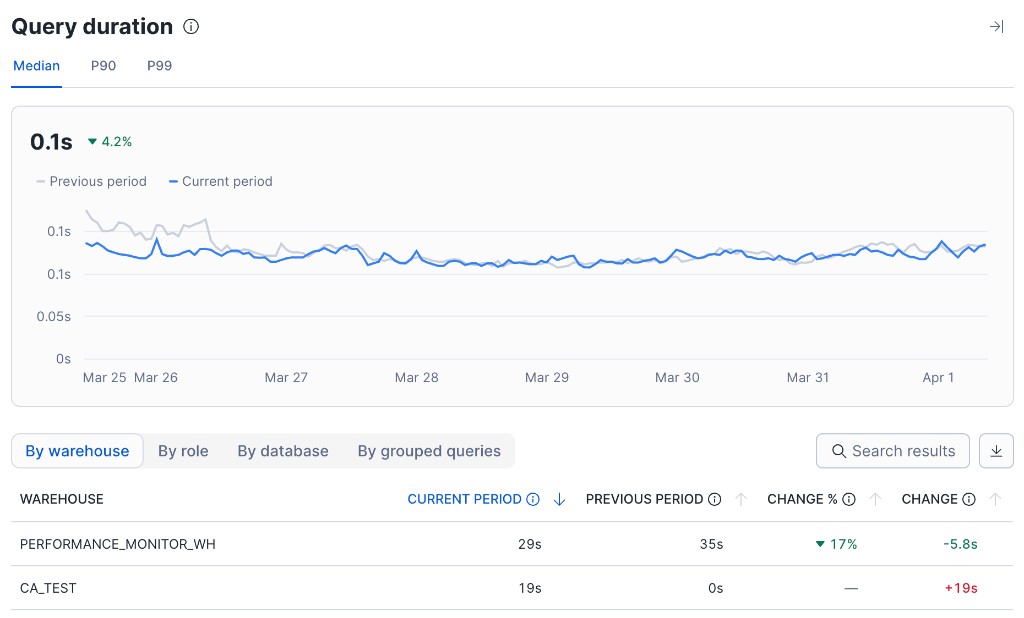
Use the Search results field above the table to filter rows; search is case-insensitive and applies across the side-panel aggregation tabs (for example, By warehouse and By role). Select the download control to export the table as a CSV file. The downloaded file name reflects the chart and the active dashboard filters.
You can select a custom period of time in a side panel by clicking where the custom period starts and dragging to where the custom period ends.
In a side panel, you can select one of the following tabs:
By warehouse - Shows the activity by warehouses in the period.
By database - Shows the activity by databases in the period.
By role - Shows the activity by roles in the period.
By grouped queries - Shows the queries that were run in the period. Some queries are redacted for security reasons. For information about how queries are grouped, see 在 Snowsight 中使用分组查询历史记录视图.
If you select a custom period, these tabs refresh to show the metrics only for the selected custom period.
The Top warehouses and Top tables sections also include events charts that are similar to the following image:
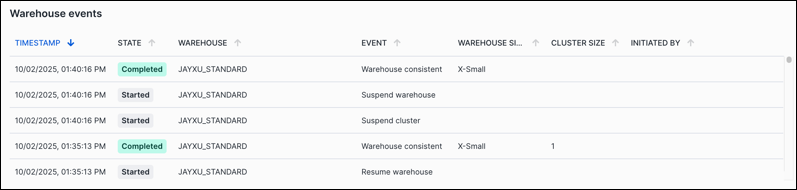
事件图表显示了该对象类型的可排序事件表。您可以检查数据中是否存在意外事件。有关仓库事件的更多信息,请参阅 WAREHOUSE_EVENTS_HISTORY 视图。有关表事件的更多信息,请参阅 TABLES 视图。
Reviewing metrics on the Queries tab
On the Queries tab, line charts cover reliability signals (failures, retries, overload, blocking) and runtime signals (duration, throughput, wait time, and hourly failure counts). Use them to review trends over the selected period. Performance Explorer summarizes historical windows for your account; it is not a live monitoring dashboard.
The following line-chart metrics are available on the Queries tab:
指标 |
单位 |
描述 |
备注 |
更多信息 |
|---|---|---|---|---|
Query failures/1K |
每 1000 次查询的失败次数 |
每运行 1,000 次查询的失败查询次数,包括以下指标:
|
该指标应较低或为零。如果查询失败,请查看查询历史记录和错误,然后修改查询以解决问题。 |
|
Query retries/1K |
每 1000 次查询的重试次数 |
每运行 1,000 次查询重试的查询次数,包括以下指标:
|
该指标应较低或为零。如果查询要重试,请查看原因,然后采取措施防止查询重试。例如,如果由于内存不足错误而重试查询,则修改仓库设置可能会解决问题。 |
|
Query overload % |
百分比 |
查询在队列中等待仓库资源占总运行时间的百分比,包括以下指标:
|
该指标应较低或为零。如果查询在运行之前处于等待状态,则仓库资源可能会耗尽,从而导致查询排队直到资源可用为止。 |
|
Query blocked % |
百分比 |
查询因等待某个资源上的事务锁而处于阻塞状态的时间,占总运行时间的百分比,包括以下指标:
|
该指标应较低或为零。如果查询被阻止,请查看查询历史记录和错误,然后修改查询以解决问题。 |
资源锁定 . . 事务的最佳实践 . . LOCK_WAIT_HISTORY 视图 . . 使用 Query History 监控查询活动 . . QUERY_HISTORY 视图 |
Query duration |
秒 |
在此期间的每小时内完成查询所花费的时间。折线图显示了所有查询的时间中位数、第九十个百分位的查询时间以及第九十九个百分位的查询时间。 |
该指标因您的数据和正在运行的查询类型而有很大差异。持续时间随时间变化的查询可能需要调查和优化。 |
|
Query throughput |
查询 |
每小时运行的查询数。 |
该指标可以揭示查询活动的变化,这可能表明工作负载的新趋势或变化。 |
|
Query wait time |
秒 |
查询等待仓库资源或因资源锁而耗费的时间量。有关状态(Overload、Provisioning、Repair 和 Blocked)的信息,请参阅 QUERY_HISTORY 视图。 |
该指标应较低或为零。如果查询在运行之前处于等待状态,则仓库资源可能会耗尽,从而导致查询排队直到资源可用为止。 |
|
Query failures |
失败 |
该时段内每小时失败的查询数量。 |
该指标应较低或为零。如果查询失败,请查看查询历史记录和错误,然后修改查询以解决问题。 |
Reviewing top warehouses
On the Warehouses tab, this section of Performance Explorer includes metrics about the warehouses in your Snowflake environment that experienced the most changes in the period. You can review these metrics to see whether your warehouses are functioning as expected to support query activity. The metrics can also show whether any warehouses are associated with trends in query activity that are unusual when compared to other warehouses. You can also determine whether the composition of the workloads that warehouses run have changed.
All metrics in this section show the metric value and the percentage of change since the last period. The percentage of change can be positive or negative, with positive change represented by an up arrow and negative change represented by a down arrow. For each metric, Performance Explorer shows the 10 warehouses with the most changes. To view metrics for more warehouses, select View details > on a chart to open the side panel. If this metric has no value from the last period for a warehouse, --- is shown instead of the percentage of change. There might be no value because the warehouse is new, or because the event being measured is infrequent.
该部分包括以下指标:
指标 |
选项卡 |
单位 |
描述 |
备注 |
更多信息 |
|---|---|---|---|---|---|
Warehouses with errors |
Query failures/1K |
每 1000 次查询的失败次数 |
对于每个仓库,每运行 1,000 次查询的失败查询数。 |
该指标应较低或为零。如果查询失败,请查看查询历史记录和错误,然后修改查询以解决问题。 |
|
Query OOM errors/1K |
每 1000 次查询的错误数 |
对于每个仓库,每运行 1,000 次查询返回“内存不足”错误的查询数。 |
该指标应较低或为零。如果查询因“内存不足”错误而失败,请查看查询历史记录以确定仓库中哪些查询失败,然后修改运行查询的仓库以避免错误。 |
使用 Query History 监控查询活动 . . QUERY_HISTORY 视图 . . 查询太大而无法放入内存 |
|
Query retries/1K |
每 1000 次查询的重试次数 |
对于每个仓库,每运行 1,000 次查询的重试查询数。 |
该指标应较低或为零。如果由于仓库内存不足而导致查询重试,请查看查询历史记录以确定仓库中哪些查询重试,然后修改运行查询的仓库以避免错误。 |
||
Warehouses with spillage |
% queries with bytes spilled |
百分比 |
对于每个仓库,查询在运行时溢出到本地磁盘或远程云存储的百分比。 |
该指标应较低或为零。如果由于仓库内存不足而导致查询溢出到磁盘,请查看查询历史记录以确定仓库中哪些查询溢出,然后修改运行查询的仓库以避免错误。 |
使用 Query History 监控查询活动 . . QUERY_HISTORY 视图 . . 查询太大而无法放入内存 |
% bytes spilled of total |
百分比 |
对于每个仓库,运行时溢出到本地磁盘或远程云存储的字节数占读取字节数的百分比。 |
该指标应较低或为零。如果由于仓库内存不足而导致查询溢出到磁盘,请查看查询历史记录以确定仓库中哪些查询溢出,然后修改运行查询的仓库以避免错误。 |
使用 Query History 监控查询活动 . . QUERY_HISTORY 视图 . . 查询太大而无法放入内存 |
|
Query wait time % |
Overload % |
百分比 |
对于每个仓库,由于仓库因查询工作负载超载而等待的查询占总运行时间的比例。 |
该指标应较低或为零。如果查询在运行之前处于等待状态,则仓库资源可能会耗尽,从而导致仓库将查询排队直到资源可用为止。 |
|
Provisioning % |
百分比 |
对于每个仓库,查询因仓库创建、恢复或调整大小而等待仓库计算资源配置的时间占总运行时间的平均比例。 |
该指标应较低或为零。如果查询在运行之前处于等待状态,则仓库资源可能会耗尽,从而导致其将查询排队直到资源可用为止。 |
||
Warehouse query performance |
Median query duration |
秒 |
对于每个仓库,查询运行时间的中位数。 |
该指标因您的数据和正在运行的查询类型而有很大差异。如果查询持续时间中位数显示异常变化,则该仓库支持的工作负载可能发生了变化,或者仓库配置可能发生了变化。 |
|
Query throughput |
查询 |
对于每个仓库,处理的查询数量。 |
该指标可以揭示查询活动的变化,这可能需要修改运行查询的仓库。 |
||
Warehouse events |
-- |
无 |
可排序的仓库事件表。 |
该指标显示了在此时段内哪些仓库发生了变化。检查数据中是否存在意外事件。 |
Reviewing top tables
On the Tables tab, this section of Performance Explorer includes metrics about the tables in your Snowflake environment that experienced the most changes in the period. You can review these metrics to see whether your tables can support query activity and return data as expected. The metrics can also show whether any tables are associated with trends in query activity that are unusual when compared to other tables. You can also determine whether any tables have changed recently and how they have changed.
All metrics in this section show the metric value and the percentage of change since the last period. The percentage of change can be positive or negative, with positive change represented by an up arrow and negative change represented by a down arrow. For each metric, Performance Explorer shows the 10 tables with the most changes. To view metrics for more tables, select View details > on a chart to open the side panel. If this metric has no value from the last period for a table, --- is shown instead of the percentage of change. There might be no value because the table is new or because the event being measured is infrequent.
该部分包括以下指标:
指标 |
选项卡 |
单位 |
描述 |
备注 |
更多信息 |
|---|---|---|---|---|---|
Table query failures/1K |
-- |
每 1000 次查询的失败次数 |
对于每个表,每运行 1,000 次查询的失败查询数。 |
该指标应较低或为零。如果查询失败,请查看查询历史记录和错误,然后修改查询以解决问题。 |
|
Table queries blocked/1K |
-- |
每 1000 次查询中被阻塞的查询数 |
对于每个表,每运行 1,000 次查询,其中被阻塞的查询数。 |
该指标应较低或为零。如果查询被阻止,请查看查询历史记录和错误,然后修改查询以解决问题。 |
资源锁定 . . 事务的最佳实践 . . LOCK_WAIT_HISTORY 视图 . . 使用 Query History 监控查询活动 . . QUERY_HISTORY 视图 |
Table read performance |
Median read query duration |
秒 |
对于每个表,查询运行时间的中位数。 |
该指标因您的数据和正在运行的查询类型而有很大差异。持续时间随时间变化的查询可能需要调查和优化。 |
|
Read query throughput |
查询 |
对于每个表,处理的查询数量。 |
该指标可以揭示表查询活动的变化。如果表的查询数量增加,则可能需要修改该表才能优化查询性能。例如,您可以对表启用搜索优化。 |
||
Table write performance |
Median write query duration |
秒 |
对于每个表,数据操作语言 (DML) 操作的运行时间中位数。 |
该指标因您的数据和正在运行的 DML 操作类型而有很大差异。持续时间随时间变化的 DML 操作可能需要调查和优化。 |
|
Write query throughput |
查询 |
对于每个表,处理的 DML 操作数。如果表的 DML 操作数量增加,则可能需要修改该表才能优化性能。 |
该指标可以揭示 DML 操作数量的变化。 |
||
Table change events |
-- |
无 |
A sortable table of table events. |
This metric shows which tables changed in the period. Examine the data for unexpected events. |