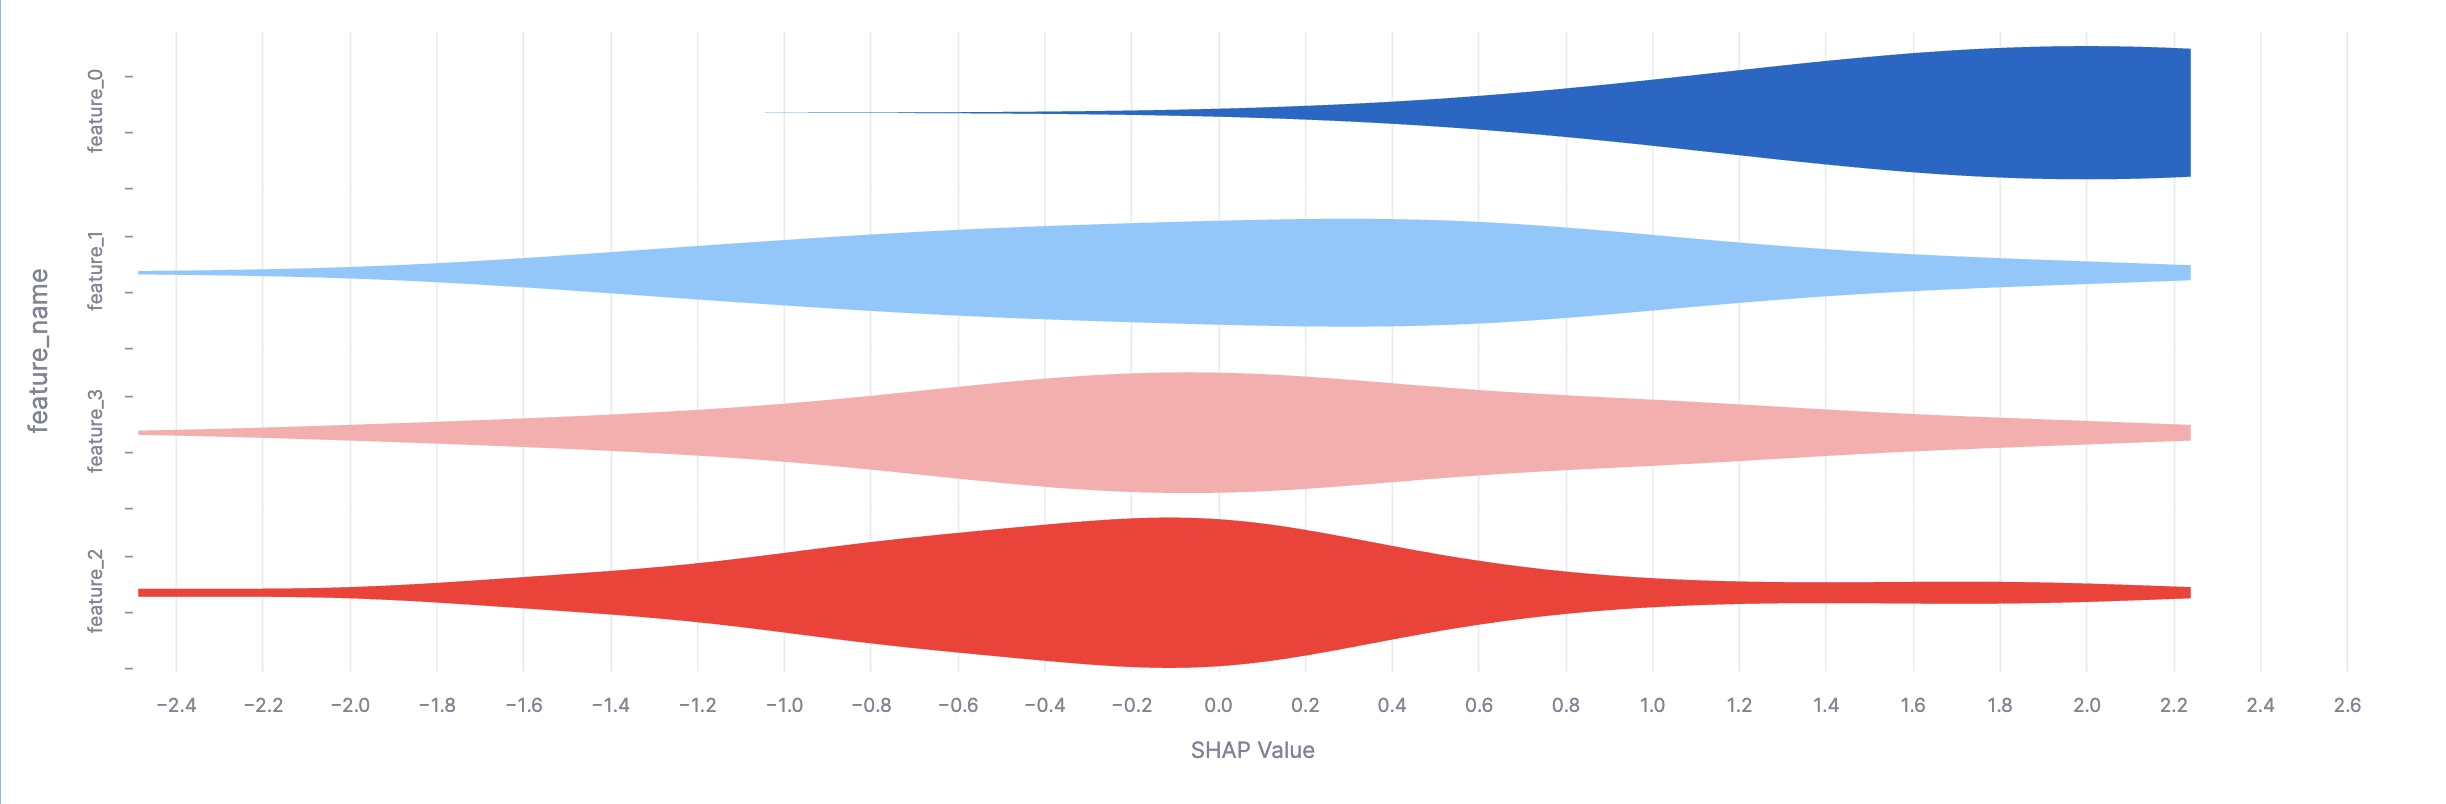
Violin Plots
Use the plot_violin() function to create a SHAP violin plot. This can be used to visualize the distribution and range of SHAP values for each feature.
Required arguments
| Argument | Description |
|---|---|
shap_df | 2D array containing SHAP values for multiple features |
feature_df | 2D array containing the corresponding feature values |
Optional arguments
| Argument | Description |
|---|---|
figsize | A tuple of (width, height) that controls the size of the plot. Uses a default size of (1400, 100) if not specified. |
The function returns a chart that visualizes a violin plot for each feature. The violin plots are sorted by the absolute mean SHAP value of each feature, with the features with the most significant influence on the model’s predictions at the top.