Force plots
Use the plot_force() function to create a visualization that shows how each feature contributes to your model’s prediction.
A feature’s contribution is represented by an arrow that directs the model’s prediction higher or lower from the base value.
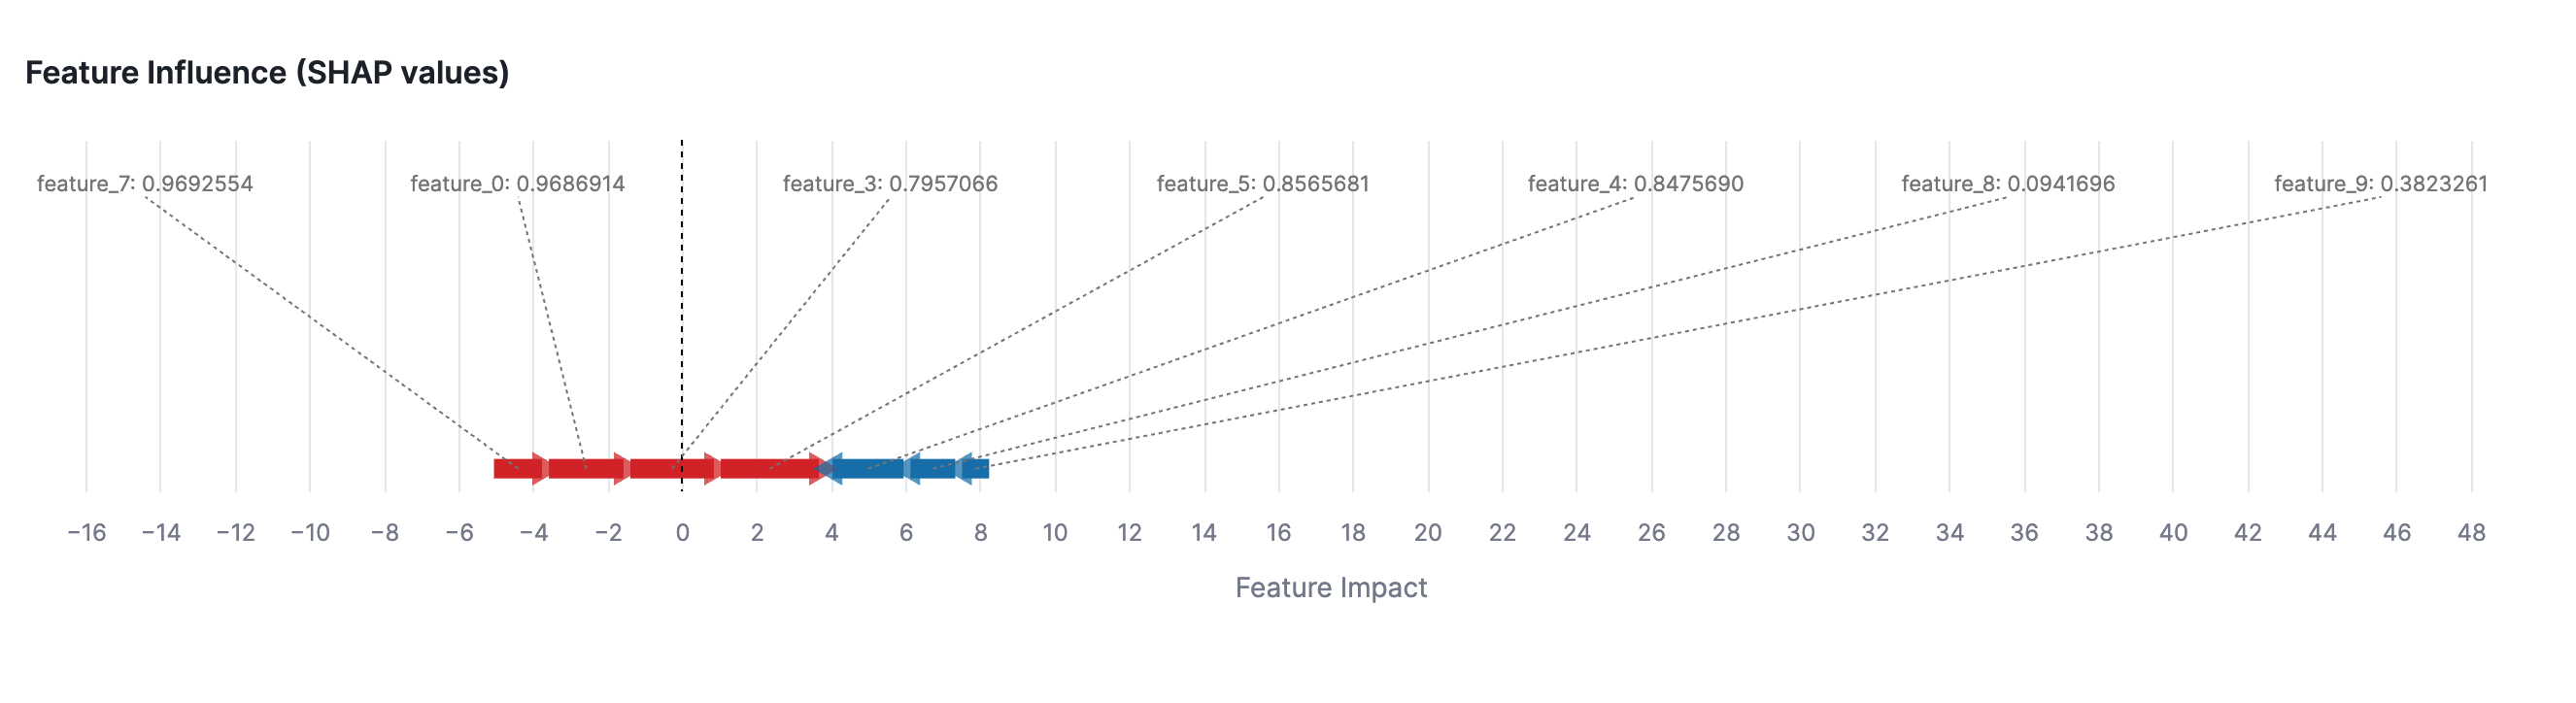
The size of the arrow in the force plot corresponds to the size of the magnitude.
In the preceding figure, feature_5 has the largest positive influence, pushing the prediction higher, while feature_4 has the largest negative influence, pulling the prediction lower. The final predicted value is approximately 4.
Required arguments
| Argument | Description |
|---|---|
shap_row | A pandas Series or Snowpark Row containing SHAP values for a specific instance. SHAP values represent how much each feature contributes to the prediction. |
features_row | A pandas Series or Snowpark Row containing the actual feature values for the same instance. These values are shown alongside their contributions. |
Optional arguments
| Argument | Description |
|---|---|
base_value | The base value that represents the model’s average prediction. This defaults to 0.0 but should typically be set to the model’s mean prediction value. |
figsize | A tuple of (width, height) that controls the size of the plot. Uses a default size of (1400, 500) if not specified. |
contribution_threshold | A float between 0 and 1 that filters which features to display. Only features with absolute SHAP values greater than this threshold (as a percentage of total absolute SHAP values) will be shown. Defaults to 0.05 (5%). |
The function returns a chart that visualizes the following items:
- The model’s prediction as a starting point
- Positive contributions (pushing prediction higher) in red
- Negative contributions (pushing prediction lower) in blue
- Feature names, feature values, and influence values as annotations
The visualization can be helpful to understand the following data points:
- Which features have the strongest influence on a specific prediction
- Whether each feature pushes the prediction higher or lower
- The magnitude of each feature’s contribution
- How the features combine to arrive at the final prediction
Note
If no features meet the contribution threshold, or if an invalid threshold is provided (not between 0 and 1), the function will raise a SnowflakeMLException.