Overview of semantic views
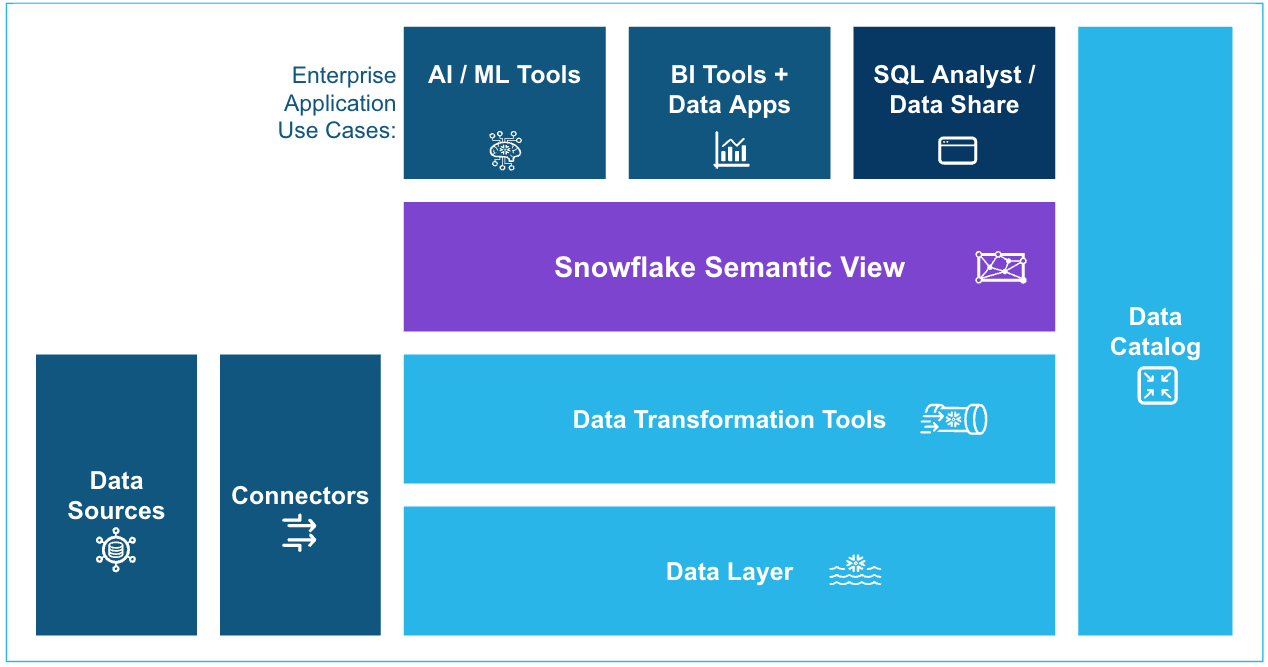
You can store semantic business concepts directly in the database in a Semantic View, which is a schema-level object. You can define business metrics and model business entities and their relationships. By adding business meaning to physical data, the semantic view enhances data-driven decisions and provides consistent business definitions across enterprise applications.
You can use Semantic Views in Cortex Analyst and query these views in a SELECT statement. You can also share Semantic Views in private listings, in public listings on the Snowflake Marketplace, and in organizational listings.
To create and manage Semantic Views, you can use SQL commands (such as CREATE SEMANTIC VIEW) or a wizard in Snowsight that guides you through the process of creating a semantic view.
Note
Semantic views are considered metadata.
Why use Semantic Views?
Semantic views address the mismatch between how business users describe data and how it’s stored in database schemas. For
example, for a critical business concept like gross revenue, the data might be stored in a table column named
amt_ttl_pre_dsc in the database, making it difficult for business users to find and interpret.
Additionally, if net revenue within a company always means gross revenue after discounts, the semantic view can define it
consistently as a metric with the correct aggregation: SUM(gross_revenue * (1 - discount)). This ensures a single
authoritative definition with proper aggregation behavior. For example, when a user asks for “Net Revenue by Region,” the semantic view knows to aggregate at the appropriate level. Without a semantic view, dozens of inconsistent calculations might exist throughout different reports and applications, often with incorrect aggregation methods leading to erroneous results.
This business-focused abstraction layer solves several common problems:
- For AI applications: Semantic views improve accuracy by combining LLM reasoning with rule-based definitions. Currently, Cortex Analyst reads the information captured in the semantic view definition and generates the SQL against the physical tables directly.
- For business intelligence (BI): Business users benefit from consistent metrics and dimensions across all tools. They can easily combine these predefined business concepts in their familiar BI interfaces to explore data and gain insights.
- For technical analysts: The centralized location for business logic reduces duplication of metric definitions across queries and simplifies complex schema relationships, making it easier to build and maintain data models.
Understanding Semantic Views
Note
Throughout this topic, database-related artifacts (such as database tables) are referred to as physical objects, and artifacts related to the semantic view are referred to as logical objects.
Within a semantic view, you define logical tables that typically correspond to business entities, such as customers, orders, or suppliers. You can define relationships between logical tables through joins on shared keys, enabling you to analyze data across entities (as you would when joining database tables).
Using logical tables, you can define:
- Facts: Facts are row-level attributes in your data model that represent specific business events or transactions. While
facts can be defined using aggregates from more detailed levels of data (such as
SUM(t.x)wheretrepresents data at a more detailed level), they are always presented as attributes at the individual row level of the logical table. Facts capture “how much” or “how many” at the most granular level, such as individual sales amounts, quantities purchased, or costs. It’s important to note that facts typically function as “helper” concepts within the semantic view to help construct dimensions and metrics. - Metrics: Metrics are quantifiable measures of business performance calculated by aggregating facts or other columns from the same table (using functions like SUM, AVG, and COUNT) across multiple rows. They transform raw data into meaningful business indicators, often combining multiple calculations in complex formulas. Examples include Total Revenue or Profit Margin Percentage. Metrics represent the KPIs in reports and dashboards that drive business decision-making.
- Dimensions: Dimensions represent categorical attributes. They provide the contextual framework that gives meaning to metrics by grouping data into meaningful categories. They answer “who,” “what,” “where,” and “when” questions, such as purchase date, customer details, product category, or location. Typically text-based or hierarchical, dimensions enable users to filter, group, and analyze data from multiple perspectives.
In a semantic view, these three elements have distinct roles, but metrics and dimensions are the primary elements that you interact with when analyzing data through the semantic view. Facts provide the underlying row-level numerical data, metrics transform data into actionable insights through aggregation and calculation, and dimensions determine viewing perspectives.
For more information about these concepts, see the YAML Specification for Semantic Views.
Interfaces for working with Semantic Views
You can use the following interfaces to create, manage, and use Semantic Views:
-
SQL commands: You can use SQL commands to create and manage Semantic Views directly. For information, see Using SQL commands to create and manage semantic views.
You can also execute a SELECT statement to query a semantic view.
-
Snowsight: You can use a wizard in Snowsight that guides you through the process of creating a semantic view. You can also upload a YAML specification that defines your semantic view. For information, see Using Snowsight to create and manage semantic views.
-
Cortex Analyst REST API: To use a semantic view with Cortex Analyst, you specify the view in the REST API request. For information, see Cortex Analyst REST API.
Getting started
To get started with Semantic Views:
-
Design your business data model.
- What business entities exist in your data (for example, customers, products, orders, and so on)?
- How do these entities relate to each other?
- What metrics are important to your business?
- What dimensions do you use to analyze these metrics?
-
Map your business concepts to your physical data.
- Which tables contain the data you need? We recommend starting with a simple star schema.
- How will you join these tables?
- What calculations are needed to derive your metrics?
-
Create a semantic view.
You can use one of these interfaces to create a semantic view.
-
Use the semantic view in the following ways:
-
Use Cortex Analyst for natural language queries of your semantic view.
You can use the Cortex Analyst REST API to perform a natural language query that uses your semantic view.
If you need to monitor the REST API requests that use your semantic view, see Cortex Analyst administrator monitoring.
-
Query the semantic view in a SELECT statement. For information, see Querying semantic views.
-
Additional information about Semantic Views
For additional information about Semantic Views, see the following topics:
- Semantic View Autopilot
- Power BI ingestion feature support
- Using Snowsight to create and manage semantic views
- Using SQL commands to create and manage semantic views
- How Snowflake validates semantic views
- Example of using SQL to create a semantic view
- Querying semantic views
For information about the privileges required to work with Semantic Views, see the following sections:
- Privileges required to create or replace a semantic view
- Privileges required to query a semantic view
- Granting privileges on semantic views
For reference information about the SQL commands and views for Semantic Views, see the following topics:
-
Documentation on SQL commands:
-
Documentation on ACCOUNT_USAGE views:
-
Documentation on INFORMATION_SCHEMA views: