Monitor catalog-linked databases in Snowsight
Snowsight provides a dedicated observability experience for catalog-linked databases. You can monitor link status, identify tables with creation or refresh issues, and troubleshoot individual databases from a centralized dashboard.
Access the Connections page
To open the observability dashboard:
- Sign in to Snowsight.
- In the navigation menu, under Horizon Catalog, select Catalog » Connections.
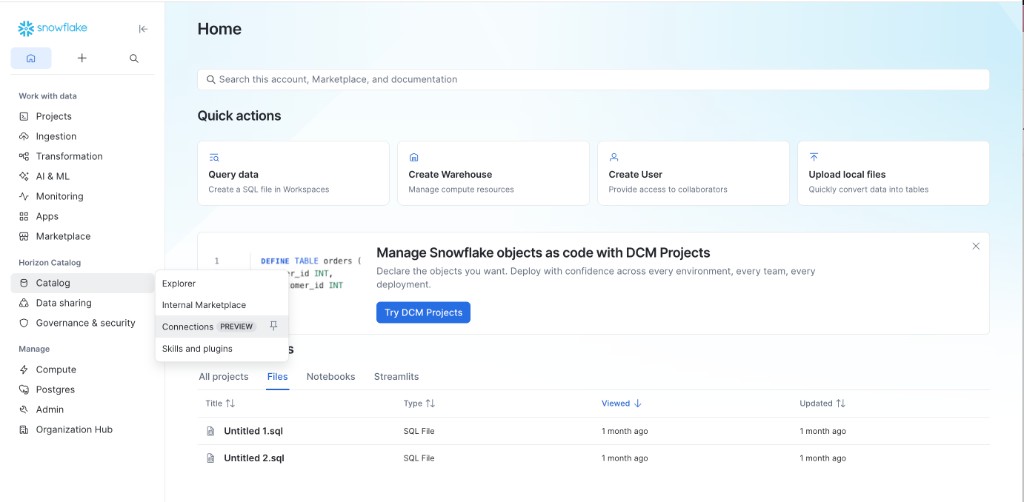
The Connections page has three tabs:
- Connect: Provides quick-start options for connecting to an external Apache Iceberg catalog or another external data source. For setup steps, see Use a catalog-linked database for Apache Iceberg™ tables.
- Data connections: Lists your catalog-linked databases, catalog integrations, and external volumes, and displays the health and refresh status of your catalog-linked databases.
- Metadata connections: Manages connections to BI tools, databases, and data pipelines for end-to-end lineage.
To monitor catalog-linked databases, select the Data connections tab, and then select the Catalog-linked databases sub-tab.
Monitor catalog-linked databases
On the Data connections tab, select Catalog-linked databases to view the health of all your catalog-linked databases in one place.
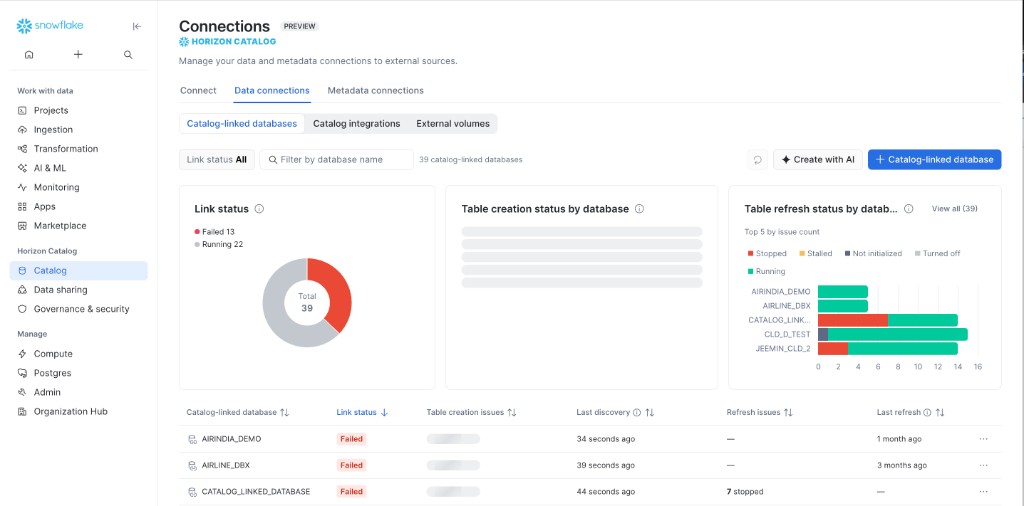
The Catalog-linked databases view displays three summary cards at the top:
- Link status: Shows the status of the auto-discovery pipe that discovers and syncs tables from your remote
catalog. Each catalog-linked database reports a state such as Running or Failed, corresponding to the
executionStatereturned by SYSTEM$CATALOG_LINK_STATUS. - Table creation status by database: Shows the databases with the most table creation issues. Each table is either Success or Failed.
- Table refresh status by database: Shows the databases with the most table refresh issues. Each table’s
auto-refresh pipe can be in a Stopped, Stalled, Not initialized, Turned off, or Running state, corresponding
to the
executionStatereturned by SYSTEM$AUTO_REFRESH_STATUS.
Select View all on the table creation or table refresh card to see the full list of databases.
The table below the summary cards lists each catalog-linked database with the following columns:
| Column | Description |
|---|---|
| Catalog-linked database | The name of the catalog-linked database. |
| Link status | The current status of the auto-discovery pipe (for example, Running or Failed). You can also check this programmatically with SYSTEM$CATALOG_LINK_STATUS. |
| Table creation issues | The number of tables that Snowflake couldn’t create from the remote catalog. |
| Last discovery | When Snowflake last started a table discovery sync with the remote catalog. |
| Refresh issues | The number of tables whose auto-refresh pipe has issues, including tables that aren’t initialized. You can check individual table status with SYSTEM$AUTO_REFRESH_STATUS. |
| Last refresh | When the most recent table auto-refresh occurred. |
You can filter the list by link status and by database name, and sort by any column.
From this view, you can also select + Catalog-linked database or + Create with AI to start a new connection. For the full Connect workflow, see Use a catalog-linked database for Apache Iceberg™ tables.
Troubleshoot with Cortex Code
You can use Cortex Code to diagnose and resolve link and refresh issues. Open Cortex Code and use the /iceberg command to describe the issue. Cortex Code analyzes the link and refresh states and provides step-by-step remediation guidance, including root cause analysis and instructions to prevent the issues from recurring.
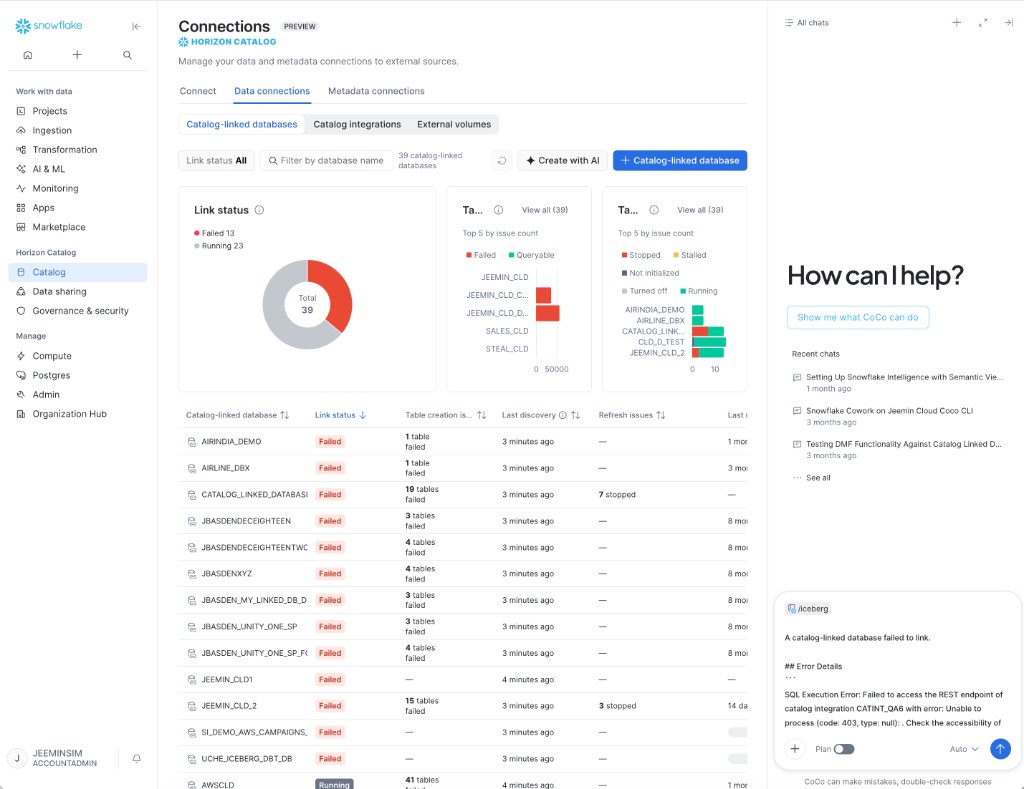
For more information about Cortex Code, see Overview of Snowflake CoCo.
View creation and refresh status for an individual database
To inspect a specific catalog-linked database, select it in the Catalog-linked databases list, or find it in Catalog » Explorer. The database opens with the Overview tab selected.
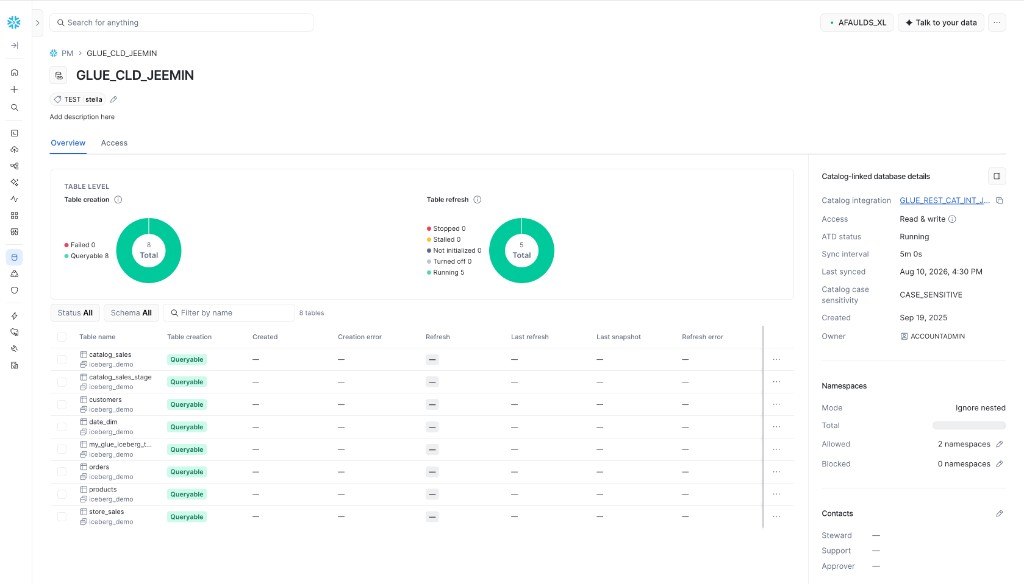
The Overview tab shows table-level observability for the database:
- Table creation: A summary of how many of the database’s tables have a Success status and how many failed to be created.
- Table refresh: A summary of the auto-refresh state for the database’s tables. Each table’s auto-refresh
pipe can be in a Stopped, Stalled, Not initialized, Turned off, or Running state, corresponding to the
executionStatereturned by SYSTEM$AUTO_REFRESH_STATUS.
Below the summary charts, a table lists the database’s tables. You can filter by status, schema, or table name, and sort by any column. The table includes the following columns:
| Column | Description |
|---|---|
| Table name | The name of the table, with its schema (namespace) from the remote catalog. |
| Table creation | Whether the table is Success or Failed. |
| Created | When Snowflake created the table. |
| Creation error | The error message if table creation failed. |
| Refresh | The current auto-refresh state of the table (for example, Running or Stopped). |
| Last refresh | When the table was last refreshed. |
| Last snapshot | The most recent Iceberg snapshot that Snowflake synced from the remote catalog. |
| Refresh error | The error message if a refresh issue occurred. |
The Overview tab also includes a details panel with the following sections:
- Catalog-linked database details: The associated catalog integration, the access mode (for example, Read & write), the automated table discovery (ATD) status, the sync interval, when the database was last synced, the catalog case sensitivity, when the database was created, and the owner.
- Namespaces: The namespace mode (for example, Ignore nested) and the number of allowed and blocked namespaces.
- Contacts: The steward, support, and approver contacts for the database.
To resolve tables that failed to be created or that aren’t initialized:
- Fix the underlying error in your remote catalog (for example, repair a corrupted Iceberg metadata file).
- Refresh the table metadata to retry.
For more information about identifying and resolving refresh issues, see Identify tables that were created but couldn’t be initialized.